
Select Country
-
 EUROPE
-
 EU 27
EU 27
-
 ALBANIA
-
 AUSTRIA
-
 BELGIUM
-
 BOSNIA & HERZEGOVINA
-
 BULGARIA
-
 CROATIA
-
 CYPRUS
-
 CZECH REPUBLIC
-
 DENMARK
-
 ESTONIA
-
 FINLAND
-
 FRANCE
-
 GERMANY
-
 GREECE
-
 HUNGARY
-
 ICELAND
-
 IRELAND
-
 ITALY
ITALY
-
 LATVIA
-
 LITHUANIA
-
 LUXEMBOURG
-
 MACEDONIA
-
 MALTA
MALTA
-
 MOLDOVA
-
 MONTENEGRO
-
 NETHERLANDS
-
 NORWAY
-
 POLAND
-
 PORTUGAL
-
 ROMANIA
-
 SERBIA (INCL.KOSOVO)
-
 SLOVAKIA
-
 SLOVENIA
-
 SPAIN
SPAIN
-
 SWEDEN
-
 SWITZERLAND
-
 TURKEY
-
 UNITED KINGDOM
ITALY

EBAA in ITALY

4
Full Members (Business aviation operators)

17
Associate Members
Key National Figures

59 M inhabitants
302,100 km2

GDP/Inhabitant (PPS): 95
EU Index - base 100Key Business Aviation figures (2024)

38,800
Jobs (direct & indirect)
7,9 billion €
Business aviation economic output
152,339
Departures & arrivals (movements)
4
Rank
1 %
Growth (over 2023)
7 %
Business aviation market share
(7% in 2023)
13,043
Unique airport pairs
(12444 in 2023 / +5%)
102
Airports with traffic
(97 in 2023 / +5)
218
Based aircraft
(203 in 2023 / +15)
I-
145
Registered aircraft
(139 in 2023 / +6)
ITALY
Business Aviation Traffic Figures
Activity Type
Origin/Destination Type
Monthly Traffic (movements)
Top Airports
ITALY
Intercontinental connections
| Intercontinental connections | Movements 2024 - both ways (growth over 2023) |
|---|---|
| Europe |
145,243
(+1%) |
| North America |
2,769
(+4%) |
| Africa |
1,884
(-9%) |
| Middle East |
1,382
(-6%) |
| Russia – Central Asia |
380
(-10%) |
| Central-South America |
346
(+16%) |
| South East Asia |
333
(+1%) |
| Top Countries | Movements 2024 - both ways (growth over 2023) |
|---|---|

Italy |
58,314
(+2%) |

France |
19,881
(+4%) |

Switzerland |
10,828
(+4%) |

United Kingdom |
10,632
(-1%) |

Germany |
9,322
(+1%) |

Spain |
7,743
(+4%) |
|
Spain |
7,615
(+1%) |

Austria |
3,658
(-3%) |

Greece |
3,323
(-1%) |

United States |
2,496
(+4%) |
| Top Countries of Europe | Movements |
|---|---|
|
Italy |
58,314
(+2%) |
|
France |
19,881
(+4%) |
|
Switzerland |
10,828
(+4%) |
|
United Kingdom |
10,632
(-1%) |
|
Germany |
9,322
(+1%) |
|
Spain |
7,743
(+4%) |
|
Spain |
7,615
(+1%) |
|
Austria |
3,658
(-3%) |
|
Greece |
3,323
(-1%) |

Turkey |
2,289
(+11%) |
| Top Countries of North America | Movements |
|---|---|
|
United States |
2,496
(+4%) |

Canada |
273
(-1%) |
| Top Countries of Africa | Movements |
|---|---|

Morocco |
413
(+15%) |

Egypt |
390
(-5%) |

Algeria |
265
(-16%) |

Libya |
184
(-23%) |

Tunisia |
154
(-31%) |

Cape Verde |
85
(+6%) |
|
Spain |
78
(+18%) |

Nigeria |
49
(+7%) |

Kenya |
31
(+94%) |

Togo |
30
(+25%) |
| Top Countries of Middle East | Movements |
|---|---|

United Arab Emirates |
595
(+7%) |

Saudi Arabia |
395
(+14%) |

Qatar |
112
(-4%) |

Jordan |
60
(-44%) |

Bahrain |
58
(-18%) |

Lebanon |
56
(-46%) |

Kuwait |
44
(-24%) |

Iraq |
42
(-37%) |

Oman |
14
(-26%) |

Afghanistan |
9
(+125%) |
| Top Countries of Russia – Central Asia | Movements |
|---|---|

Azerbaijan |
133 |

Kazakhstan |
115
(+2%) |

Georgia |
76
(+15%) |

Uzbekistan |
33
(-42%) |

Armenia |
14
(-56%) |

Kyrgyzstan |
5
(-17%) |

Belarus |
4
(-50%) |

Turkmenistan |
3
(-50%) |

Russia |
3
(-99%) |

Tajikistan |
1
NEW |
| Top Countries of Central-South America | Movements |
|---|---|

Brazil |
159
(+46%) |

Bahamas |
27
(+29%) |

Mexico |
24
(+26%) |

Antigua and Barbuda |
22
(-29%) |

Saint Vincent and the Grenadines |
19
(-24%) |

Dominican Republic |
16 |

Sint Maarten |
14
(-26%) |

Bermuda |
11
(+57%) |

Turks and Caicos Islands |
7 |

Puerto Rico |
5
(-58%) |
| Top Countries of South East Asia | Movements |
|---|---|

India |
130
(+8%) |

China |
43
(-7%) |

Maldives |
37
(-14%) |

Hong Kong |
26
(-32%) |

Japan |
24
(+26%) |

Singapore |
16
(+23%) |

Thailand |
16
(+60%) |

Sri Lanka |
12
(+71%) |

South Korea |
11
(-21%) |

Brunei |
5
(+150%) |
ITALY
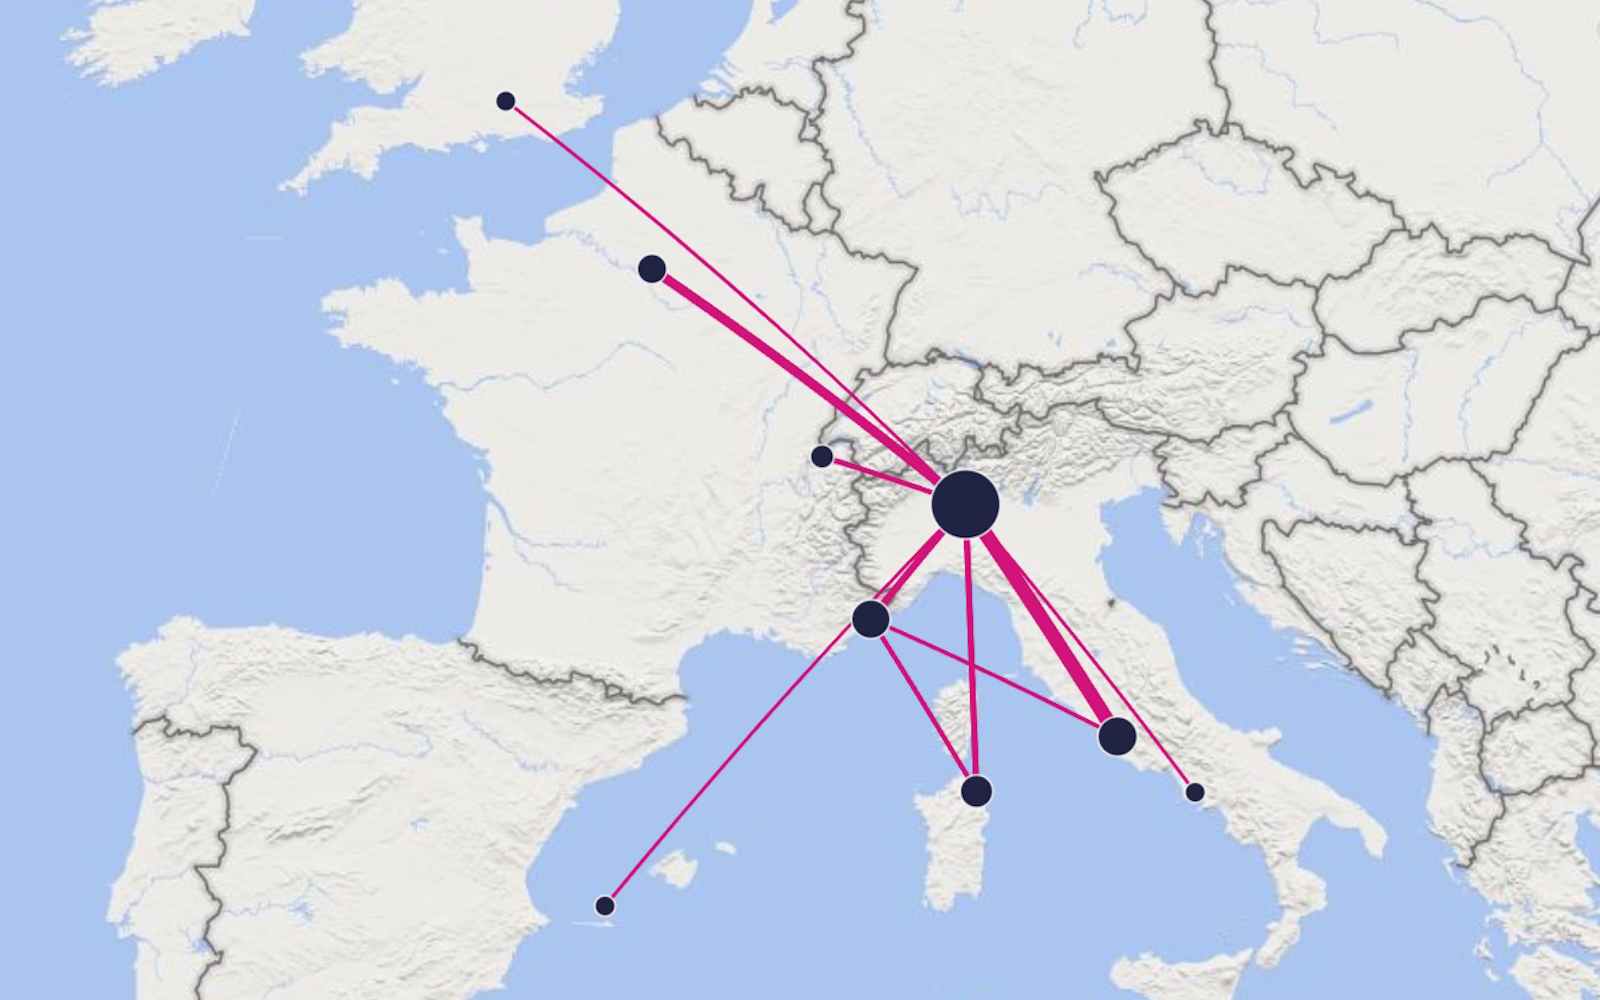
Top 10 airports pairs - Flights 2024 - both ways (growth over 2023)
|
Roma Ciampino |
Milano Linate |
1,951
(+4%) |
|
Milano Linate |
Paris Le Bourget |
1,332
(-1%) |
|
Milano Linate |
Nice Côte d Azur |
1,116
(+7%) |
|
Milano Linate |
Olbia Costa Smeralda |
1,028
(+11%) |
|
Milano Linate |
Geneva International |
877
(+12%) |
|
Olbia Costa Smeralda |
Nice Côte d Azur |
758
(+3%) |
|
Roma Ciampino |
Nice Côte d Azur |
662
(+6%) |
|
Roma Ciampino |
Olbia Costa Smeralda |
578
(+21%) |
|
Roma Ciampino |
Paris Le Bourget |
555
(+8%) |
|
Milano Linate |
Farnborough |
519
(-3%) |
ITALY
Business aviation fleet figures
Based aircraft
Registered aircraft
-

8
3
Bizliner
-

56
40
Heavy Jet
-

21
16
Midsize Jet
-

59
36
Light Jet
-

56
47
Twin Engine Turboprop
-

18
3
Single Engine Turboprop
| Top active aircraft (2024) | Segment | Departures | Arrivals | Totals |
|---|---|---|---|---|
| Cessna Citation Excel / XLS | Light Jet | 5,270 | 5,271 |
10,541
(-8%) |
| Embraer Phenom 300 | Light Jet | 4,069 | 4,080 |
8,149
(+18%) |
| Pilatus PC-12 | Turboprop | 3,981 | 3,995 |
7,976
(+2%) |
| Piaggio P180 Avanti | Turboprop | 3,747 | 3,745 |
7,492
(-1%) |
| Dassault Falcon 2000 | Heavy Jet | 3,313 | 3,315 |
6,628
(-4%) |