
Select Country
-
 EUROPE
-
 EU 27
EU 27
-
 ALBANIA
-
 AUSTRIA
-
 BELGIUM
-
 BOSNIA & HERZEGOVINA
-
 BULGARIA
-
 CROATIA
-
 CYPRUS
-
 CZECH REPUBLIC
-
 DENMARK
-
 ESTONIA
-
 FINLAND
-
 FRANCE
-
 GERMANY
-
 GREECE
-
 HUNGARY
-
 ICELAND
-
 IRELAND
-
 ITALY
ITALY
-
 LATVIA
-
 LITHUANIA
-
 LUXEMBOURG
-
 MACEDONIA
-
 MALTA
MALTA
-
 MOLDOVA
-
 MONTENEGRO
-
 NETHERLANDS
-
 NORWAY
-
 POLAND
-
 PORTUGAL
-
 ROMANIA
-
 SERBIA (INCL.KOSOVO)
-
 SLOVAKIA
-
 SLOVENIA
-
 SPAIN
SPAIN
-
 SWEDEN
-
 SWITZERLAND
-
 TURKEY
-
 UNITED KINGDOM
UNITED KINGDOM

EBAA in UNITED KINGDOM

22
Full Members (Business aviation operators)

132
Associate Members

Office 1, Brook Farm Barns Dorton Aylesbury Bucks. HP18 9NQ UK
T +44 1844 238020
M rachael.paskin@bbga.aero
W www.bbga.aero
People
CEO : Marc Bailey
Key National Figures

67,3 M inhabitants
248,500 km2

GDP/Inhabitant (PPS): 102
EU Index - base 100Key Business Aviation figures (2024)

58,900
Jobs (direct & indirect)
11,7 billion €
Business aviation economic output
208,895
Departures & arrivals (movements)
2
Rank
0 %
Growth (over 2023)
6 %
Business aviation market share
(6% in 2023)
14,221
Unique airport pairs
(13817 in 2023 / +3%)
148
Airports with traffic
(146 in 2023 / +2)
524
Based aircraft
(528 in 2023 / -4)
G-
244
Registered aircraft
(258 in 2023 / -14)
UNITED KINGDOM
Business Aviation Traffic Figures
Activity Type
Origin/Destination Type
Monthly Traffic (movements)
Top Airports
UNITED KINGDOM
Intercontinental connections
| Intercontinental connections | Movements 2024 - both ways (growth over 2023) |
|---|---|
| Europe |
191,793
(-1%) |
| North America |
9,017
(+8%) |
| Middle East |
3,003
(+3%) |
| Africa |
2,379
(+1%) |
| South East Asia |
1,312
(+13%) |
| Central-South America |
897
(+13%) |
| Russia – Central Asia |
486
(-2%) |
| Top Countries | Movements 2024 - both ways (growth over 2023) |
|---|---|

United Kingdom |
86,455 |

France |
24,682
(-3%) |

Spain |
11,648
(+4%) |
|
Spain |
11,177
(-8%) |

Switzerland |
10,937
(-4%) |

Germany |
10,890 |

Italy |
10,632
(-1%) |

United States |
8,101
(+8%) |

Ireland |
6,161
(+1%) |

Netherlands |
4,890
(-7%) |
| Top Countries of Europe | Movements |
|---|---|
|
United Kingdom |
86,455 |
|
France |
24,682
(-3%) |
|
Spain |
11,648
(+4%) |
|
Spain |
11,177
(-8%) |
|
Switzerland |
10,937
(-4%) |
|
Germany |
10,890 |
|
Italy |
10,632
(-1%) |
|
Ireland |
6,161
(+1%) |
|
Netherlands |
4,890
(-7%) |

Belgium |
3,097
(-7%) |
| Top Countries of North America | Movements |
|---|---|
|
United States |
8,101
(+8%) |

Canada |
916
(+3%) |
| Top Countries of Middle East | Movements |
|---|---|

United Arab Emirates |
1,382
(-4%) |

Saudi Arabia |
710
(+11%) |

Qatar |
272
(+16%) |

Bahrain |
236
(+32%) |

Kuwait |
136
(-7%) |

Jordan |
101
(-20%) |

Oman |
70
(+15%) |

Lebanon |
39
(-25%) |

Iraq |
37
(+54%) |

Pakistan |
20
(-5%) |
| Top Countries of Africa | Movements |
|---|---|

Morocco |
610
(+12%) |

Nigeria |
507
(-2%) |
|
Spain |
347
(+4%) |

Egypt |
308
(+3%) |

South Africa |
113
(-6%) |

Tunisia |
48
(+26%) |

Cape Verde |
45
(-17%) |

Algeria |
44 |

Kenya |
41
(+78%) |

Ghana |
40
(+60%) |
| Top Countries of South East Asia | Movements |
|---|---|

India |
520
(-7%) |

China |
477
(+72%) |

Hong Kong |
88
(-1%) |

Maldives |
52
(-26%) |

Thailand |
45
(+25%) |

Japan |
31
(+29%) |

Singapore |
29
(-33%) |

Cambodia |
12
(+20%) |

South Korea |
12
(+50%) |

Sri Lanka |
11
(+57%) |
| Top Countries of Central-South America | Movements |
|---|---|

Brazil |
165
(+34%) |

Bahamas |
111
(+10%) |

Barbados |
85 |

Bermuda |
70
(+6%) |

Antigua and Barbuda |
70
(+23%) |

Sint Maarten |
67
(-12%) |

Saint Vincent and the Grenadines |
60
(+62%) |

Mexico |
44
(-10%) |

Turks and Caicos Islands |
24 |

British Virgin Islands |
23
(-4%) |
| Top Countries of Russia – Central Asia | Movements |
|---|---|

Azerbaijan |
217
(+14%) |

Kazakhstan |
153
(-10%) |

Georgia |
60
(+46%) |

Uzbekistan |
41
(-9%) |

Turkmenistan |
10
(-55%) |

Armenia |
10
(-41%) |

Russia |
4
(-99%) |

Kyrgyzstan |
4
(-56%) |

Belarus |
3
(+50%) |

Tajikistan |
1
(-50%) |
UNITED KINGDOM
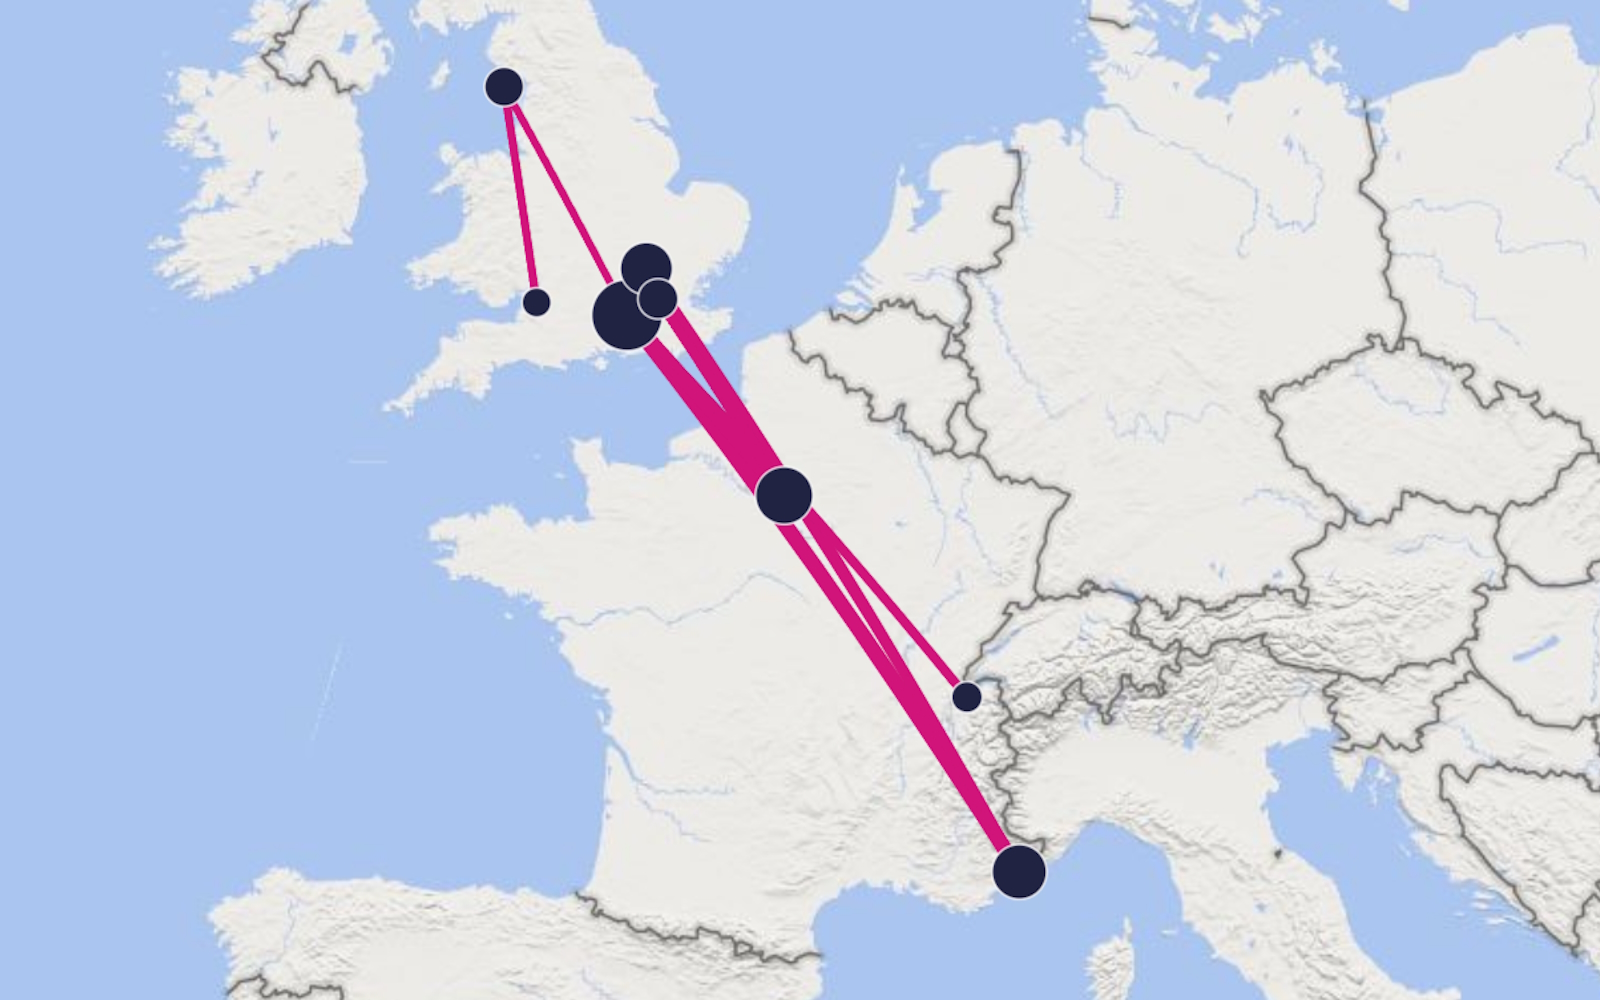
Top 10 airports pairs - Flights 2024 - both ways (growth over 2023)
|
Farnborough |
Nice Côte d Azur |
1,460
(-13%) |
|
London Luton |
Paris Le Bourget |
1,439
(+4%) |
|
Farnborough |
Paris Le Bourget |
1,428
(-11%) |
|
London Luton |
Nice Côte d Azur |
1,200 |
|
London Biggin Hill |
Paris Le Bourget |
1,189
(+6%) |
|
Farnborough |
Geneva International |
1,006
(-11%) |
|
Walney Island |
Bristol |
939
(-4%) |
|
Walney Island |
Farnborough |
923
(+2%) |
|
Farnborough |
London Luton |
841
(-3%) |
|
Liverpool John Lennon International |

Ronaldsway |
811
(-5%) |
UNITED KINGDOM
Business aviation fleet figures
Based aircraft
Registered aircraft
-

18
2
Bizliner
-

164
45
Heavy Jet
-

66
51
Midsize Jet
-

93
29
Light Jet
-

95
75
Twin Engine Turboprop
-

88
42
Single Engine Turboprop
| Top active aircraft (2024) | Segment | Departures | Arrivals | Totals |
|---|---|---|---|---|
| King Air 200 | Turboprop | 13,596 | 13,591 |
27,187
(-2%) |
| Pilatus PC-12 | Turboprop | 7,155 | 7,134 |
14,289
(+1%) |
| Cessna Citation Excel / XLS | Light Jet | 7,087 | 7,099 |
14,186
(-7%) |
| Embraer Phenom 300 | Light Jet | 6,647 | 6,644 |
13,291
(+9%) |
| Global Express / 6000 | Heavy Jet | 4,672 | 4,702 |
9,374
(-4%) |