
Select Country
-
 EUROPE
-
 EU 27
EU 27
-
 ALBANIA
-
 AUSTRIA
-
 BELGIUM
-
 BOSNIA & HERZEGOVINA
-
 BULGARIA
-
 CROATIA
-
 CYPRUS
-
 CZECH REPUBLIC
-
 DENMARK
-
 ESTONIA
-
 FINLAND
-
 FRANCE
-
 GERMANY
-
 GREECE
-
 HUNGARY
-
 ICELAND
-
 IRELAND
-
 ITALY
ITALY
-
 LATVIA
-
 LITHUANIA
-
 LUXEMBOURG
-
 MACEDONIA
-
 MALTA
MALTA
-
 MOLDOVA
-
 MONTENEGRO
-
 NETHERLANDS
-
 NORWAY
-
 POLAND
-
 PORTUGAL
-
 ROMANIA
-
 SERBIA (INCL.KOSOVO)
-
 SLOVAKIA
-
 SLOVENIA
-
 SPAIN
SPAIN
-
 SWEDEN
-
 SWITZERLAND
-
 TURKEY
-
 UNITED KINGDOM
SWITZERLAND

EBAA in SWITZERLAND

10
Full Members (Business aviation operators)

37
Associate Members
SBAA
P.O Box 2223 CH-8060 Zurich-Airport SWITZERLAND
T +41 44 804 11 80
M info@sbaa.swiss
W www.sbaa.swiss
People
Key National Figures

8,7 M inhabitants
41,300 km2

GDP/Inhabitant (PPS): 155
EU Index - base 100Key Business Aviation figures (2024)

18,950
Jobs (direct & indirect)
6,2 billion €
Business aviation economic output
98,559
Departures & arrivals (movements)
6
Rank
0 %
Growth (over 2023)
6 %
Business aviation market share
(6% in 2023)
5,671
Unique airport pairs
(5401 in 2023 / +5%)
30
Airports with traffic
(28 in 2023 / +2)
225
Based aircraft
(234 in 2023 / -9)
HB-
130
Registered aircraft
(134 in 2023 / -4)
SWITZERLAND
Business Aviation Traffic Figures
Activity Type
Origin/Destination Type
Monthly Traffic (movements)
Top Airports
SWITZERLAND
Intercontinental connections
| Intercontinental connections | Movements 2024 - both ways (growth over 2023) |
|---|---|
| Europe | 93,291 |
| North America |
1,592
(-2%) |
| Africa |
1,326
(-1%) |
| Middle East |
1,318
(-9%) |
| Central-South America |
398
(+7%) |
| Russia – Central Asia |
347
(-11%) |
| South East Asia |
282
(+9%) |
| Top Countries | Movements 2024 - both ways (growth over 2023) |
|---|---|

France |
21,732
(+2%) |

Switzerland |
11,672
(-2%) |

United Kingdom |
10,937
(-4%) |

Italy |
10,828
(+4%) |

Germany |
10,656
(-3%) |

Spain |
5,654
(+1%) |
|
Spain |
5,525
(-10%) |

Austria |
3,341
(+4%) |

Belgium |
2,348
(+6%) |

Netherlands |
2,113
(-3%) |
| Top Countries of Europe | Movements |
|---|---|
|
France |
21,732
(+2%) |
|
Switzerland |
11,672
(-2%) |
|
United Kingdom |
10,937
(-4%) |
|
Italy |
10,828
(+4%) |
|
Germany |
10,656
(-3%) |
|
Spain |
5,654
(+1%) |
|
Spain |
5,525
(-10%) |
|
Austria |
3,341
(+4%) |
|
Belgium |
2,348
(+6%) |
|
Netherlands |
2,113
(-3%) |
| Top Countries of North America | Movements |
|---|---|

United States |
1,440 |

Canada |
152
(-16%) |
| Top Countries of Africa | Movements |
|---|---|

Morocco |
441
(+3%) |

Egypt |
263
(-10%) |
|
Spain |
129
(-17%) |

Nigeria |
77
(+103%) |

Tunisia |
46 |

Algeria |
45
(-36%) |

Cape Verde |
39
(-3%) |

Cameroon |
38
(+280%) |

South Africa |
28
(-32%) |

Senegal |
27
(-29%) |
| Top Countries of Middle East | Movements |
|---|---|

United Arab Emirates |
626
(-12%) |

Saudi Arabia |
382
(+8%) |

Qatar |
69
(+10%) |

Iraq |
49
(-20%) |

Kuwait |
42
(-13%) |

Bahrain |
37
(+32%) |

Oman |
36
(-23%) |

Lebanon |
29
(-42%) |

Jordan |
26
(-58%) |

Pakistan |
20
(+25%) |
| Top Countries of Central-South America | Movements |
|---|---|

Brazil |
123
(+29%) |

Bahamas |
58
(+2%) |

Sint Maarten |
51
(-7%) |

Mexico |
39
(+34%) |

Antigua and Barbuda |
29
(+45%) |

Cayman Islands |
13
(+117%) |

Costa Rica |
12
(+9%) |

Saint Vincent and the Grenadines |
11
(+38%) |

Argentina |
10
(+150%) |

Turks and Caicos Islands |
9
(-25%) |
| Top Countries of Russia – Central Asia | Movements |
|---|---|

Azerbaijan |
158
(-5%) |

Kazakhstan |
90
(+13%) |

Uzbekistan |
38
(-3%) |

Georgia |
34
(-41%) |

Kyrgyzstan |
11
(-8%) |

Armenia |
6
(-67%) |

Tajikistan |
6
(+20%) |

Turkmenistan |
4
(-20%) |

Belarus |
3
(-50%) |

Russia |
1
(-100%) |
| Top Countries of South East Asia | Movements |
|---|---|

India |
79
(+11%) |

Maldives |
51
(-6%) |

China |
43
(+48%) |

Thailand |
23 |

Hong Kong |
16
(-38%) |

Japan |
16
(+14%) |

Singapore |
12
(+33%) |

Indonesia |
11
(+450%) |

South Korea |
10
(-23%) |

Sri Lanka |
6
(+20%) |
SWITZERLAND
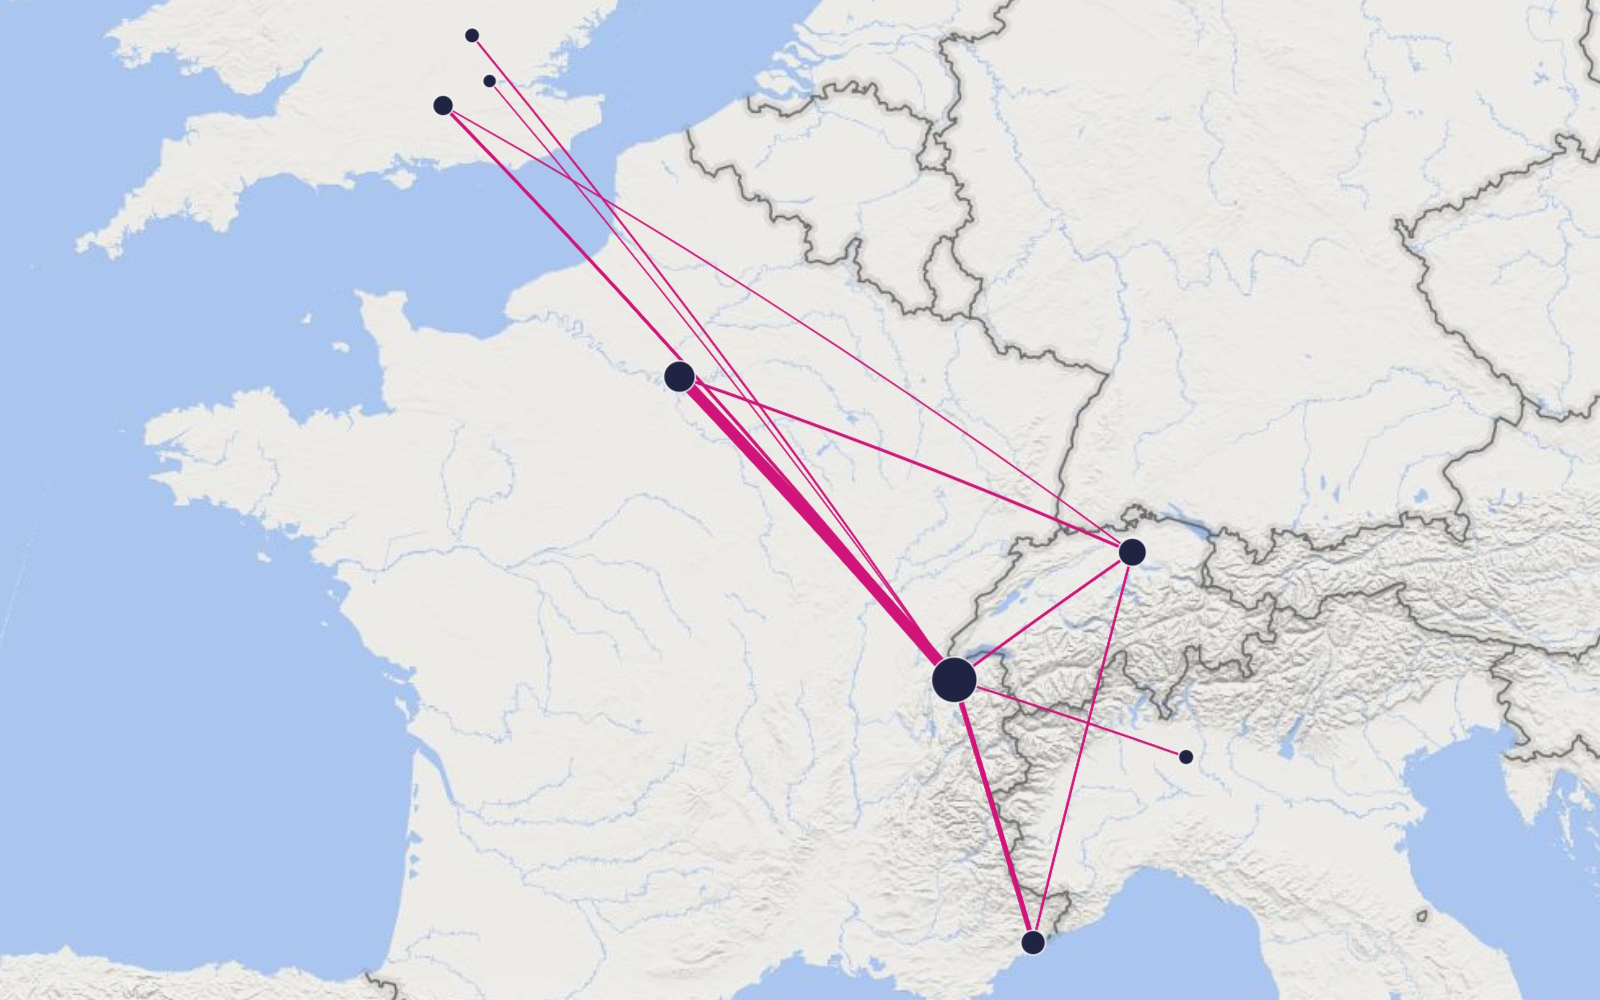
Top 10 airports pairs - Flights 2024 - both ways (growth over 2023)
|
Geneva International |
Paris Le Bourget |
3,363
(-1%) |
|
Geneva International |
Nice Côte d Azur |
1,749
(+4%) |
|
Geneva International |
Farnborough |
1,006
(-11%) |
|
Zurich |
Paris Le Bourget |
934
(-9%) |
|
Zurich |
Geneva International |
910
(-9%) |
|
Zurich |
Nice Côte d Azur |
904
(+2%) |
|
Geneva International |
Milano Linate |
877
(+12%) |
|
Geneva International |
London Luton |
733
(-2%) |
|
Zurich |
Farnborough |
577
(+1%) |
|
Geneva International |
Cannes Mandelieu |
534
(-4%) |
SWITZERLAND
Business aviation fleet figures
Based aircraft
Registered aircraft
-

7
1
Bizliner
-

82
51
Heavy Jet
-

10
3
Midsize Jet
-

55
26
Light Jet
-

15
10
Twin Engine Turboprop
-

56
39
Single Engine Turboprop
| Top active aircraft (2024) | Segment | Departures | Arrivals | Totals |
|---|---|---|---|---|
| Pilatus PC-12 | Turboprop | 8,440 | 8,286 |
16,726
(+8%) |
| Embraer Phenom 300 | Light Jet | 3,972 | 3,955 |
7,927
(+8%) |
| Cessna Citation Excel / XLS | Light Jet | 3,250 | 3,237 |
6,487
(-11%) |
| Pilatus PC24 | Light Jet | 2,892 | 2,827 |
5,719
(+18%) |
| Cessna Citation Latitude | Midsize Jet | 2,471 | 2,466 |
4,937
(+6%) |