
Select Country
-
 EUROPE
-
 EU 27
EU 27
-
 ALBANIA
-
 AUSTRIA
-
 BELGIUM
-
 BOSNIA & HERZEGOVINA
-
 BULGARIA
-
 CROATIA
-
 CYPRUS
-
 CZECH REPUBLIC
-
 DENMARK
-
 ESTONIA
-
 FINLAND
-
 FRANCE
-
 GERMANY
-
 GREECE
-
 HUNGARY
-
 ICELAND
-
 IRELAND
-
 ITALY
ITALY
-
 LATVIA
-
 LITHUANIA
-
 LUXEMBOURG
-
 MACEDONIA
-
 MALTA
MALTA
-
 MOLDOVA
-
 MONTENEGRO
-
 NETHERLANDS
-
 NORWAY
-
 POLAND
-
 PORTUGAL
-
 ROMANIA
-
 SERBIA (INCL.KOSOVO)
-
 SLOVAKIA
-
 SLOVENIA
-
 SPAIN
SPAIN
-
 SWEDEN
-
 SWITZERLAND
-
 TURKEY
-
 UNITED KINGDOM
FRANCE

EBAA in FRANCE

11
Full Members (Business aviation operators)

60
Associate Members

EBAA France
22, avenue Franklin Delano Roosevelt 75008 Paris
T +33 1 86 64 12 35
M ebaafrance@ebaafrance.aero
W www.ebaafrance.fr
People
President : Charles Aguettant
Vice President : Paul Tiba
Vice President : Sarra Kriai
Secretary-General : Nicolas Fischel
Treasurer : Nicolas Ziza
Key National Figures

67,8 M inhabitants
632,800 km2

GDP/Inhabitant (PPS): 104
EU Index - base 100Key Business Aviation figures (2024)

101,500
Jobs (direct & indirect)
32,1 billion €
Business aviation economic output
243,461
Departures & arrivals (movements)
1
Rank
-3 %
Growth (over 2023)
9 %
Business aviation market share
(9% in 2023)
18,944
Unique airport pairs
(18995 in 2023 / 0%)
262
Airports with traffic
(277 in 2023 / -15)
495
Based aircraft
(493 in 2023 / +2)
F-
351
Registered aircraft
(354 in 2023 / -3)
FRANCE
Business Aviation Traffic Figures
Activity Type
Origin/Destination Type
Monthly Traffic (movements)
Top Airports
FRANCE
Intercontinental connections
| Intercontinental connections | Movements 2024 - both ways (growth over 2023) |
|---|---|
| Europe |
230,217
(-3%) |
| Africa |
4,807
(-7%) |
| North America |
4,578
(+7%) |
| Middle East |
2,453
(-7%) |
| Central-South America |
530
(+14%) |
| Russia – Central Asia |
436
(-10%) |
| South East Asia |
432
(+12%) |
| Top Countries | Movements 2024 - both ways (growth over 2023) |
|---|---|

France |
102,833
(-6%) |

United Kingdom |
24,682
(-3%) |

Switzerland |
21,732
(+2%) |

Italy |
19,881
(+4%) |

Spain |
13,518
(+3%) |
|
Spain |
12,938
(-6%) |

Germany |
12,355
(-3%) |

Belgium |
6,087
(-4%) |

United States |
4,129
(+9%) |

Netherlands |
3,645
(-6%) |
| Top Countries of Europe | Movements |
|---|---|
|
France |
102,833
(-6%) |
|
United Kingdom |
24,682
(-3%) |
|
Switzerland |
21,732
(+2%) |
|
Italy |
19,881
(+4%) |
|
Spain |
13,518
(+3%) |
|
Spain |
12,938
(-6%) |
|
Germany |
12,355
(-3%) |
|
Belgium |
6,087
(-4%) |
|
Netherlands |
3,645
(-6%) |

Austria |
3,190
(-2%) |
| Top Countries of Africa | Movements |
|---|---|

Morocco |
1,829
(+5%) |

Algeria |
752
(-19%) |

Tunisia |
398
(-36%) |

Egypt |
353
(+3%) |

Nigeria |
208
(+19%) |
|
Spain |
185
(+17%) |

Libya |
134
(-5%) |
.png)
Congo (Brazzaville) |
109
(+1%) |

Côte d Ivoire |
103
(+16%) |

Cape Verde |
94
(-27%) |
| Top Countries of North America | Movements |
|---|---|
|
United States |
4,129
(+9%) |

Canada |
449
(-5%) |
| Top Countries of Middle East | Movements |
|---|---|

United Arab Emirates |
881
(+4%) |

Saudi Arabia |
781
(-7%) |

Qatar |
254
(-14%) |

Lebanon |
176
(-35%) |

Bahrain |
98
(+15%) |

Jordan |
88
(-22%) |

Kuwait |
86
(+21%) |

Iraq |
61
(-18%) |

Oman |
25 |

Iran |
2
(-71%) |
| Top Countries of Central-South America | Movements |
|---|---|

Brazil |
224
(+22%) |

Bahamas |
62
(+19%) |

Mexico |
43
(+23%) |

Sint Maarten |
42
(+8%) |

Saint Vincent and the Grenadines |
26
(+44%) |

Dominican Republic |
19
(+171%) |

Antigua and Barbuda |
17
(+21%) |

Barbados |
13
(-13%) |

Bermuda |
11
(+38%) |

Cayman Islands |
9
(+29%) |
| Top Countries of Russia – Central Asia | Movements |
|---|---|

Kazakhstan |
141
(-4%) |

Azerbaijan |
133
(-22%) |

Georgia |
75
(-3%) |

Uzbekistan |
56
(+12%) |

Armenia |
13
(-32%) |

Russia |
5
(-17%) |

Kyrgyzstan |
4 |

Turkmenistan |
4
(-50%) |

Tajikistan |
3
(+200%) |

Belarus |
2
(-50%) |
| Top Countries of South East Asia | Movements |
|---|---|

India |
132
(+47%) |

China |
80
(+27%) |

Hong Kong |
50
(-7%) |

Maldives |
46
(-6%) |

Japan |
28
(-18%) |

Thailand |
27
(+42%) |

South Korea |
16
(-45%) |

Singapore |
14
(+8%) |

Sri Lanka |
9
(+200%) |

Vietnam |
8 |
FRANCE
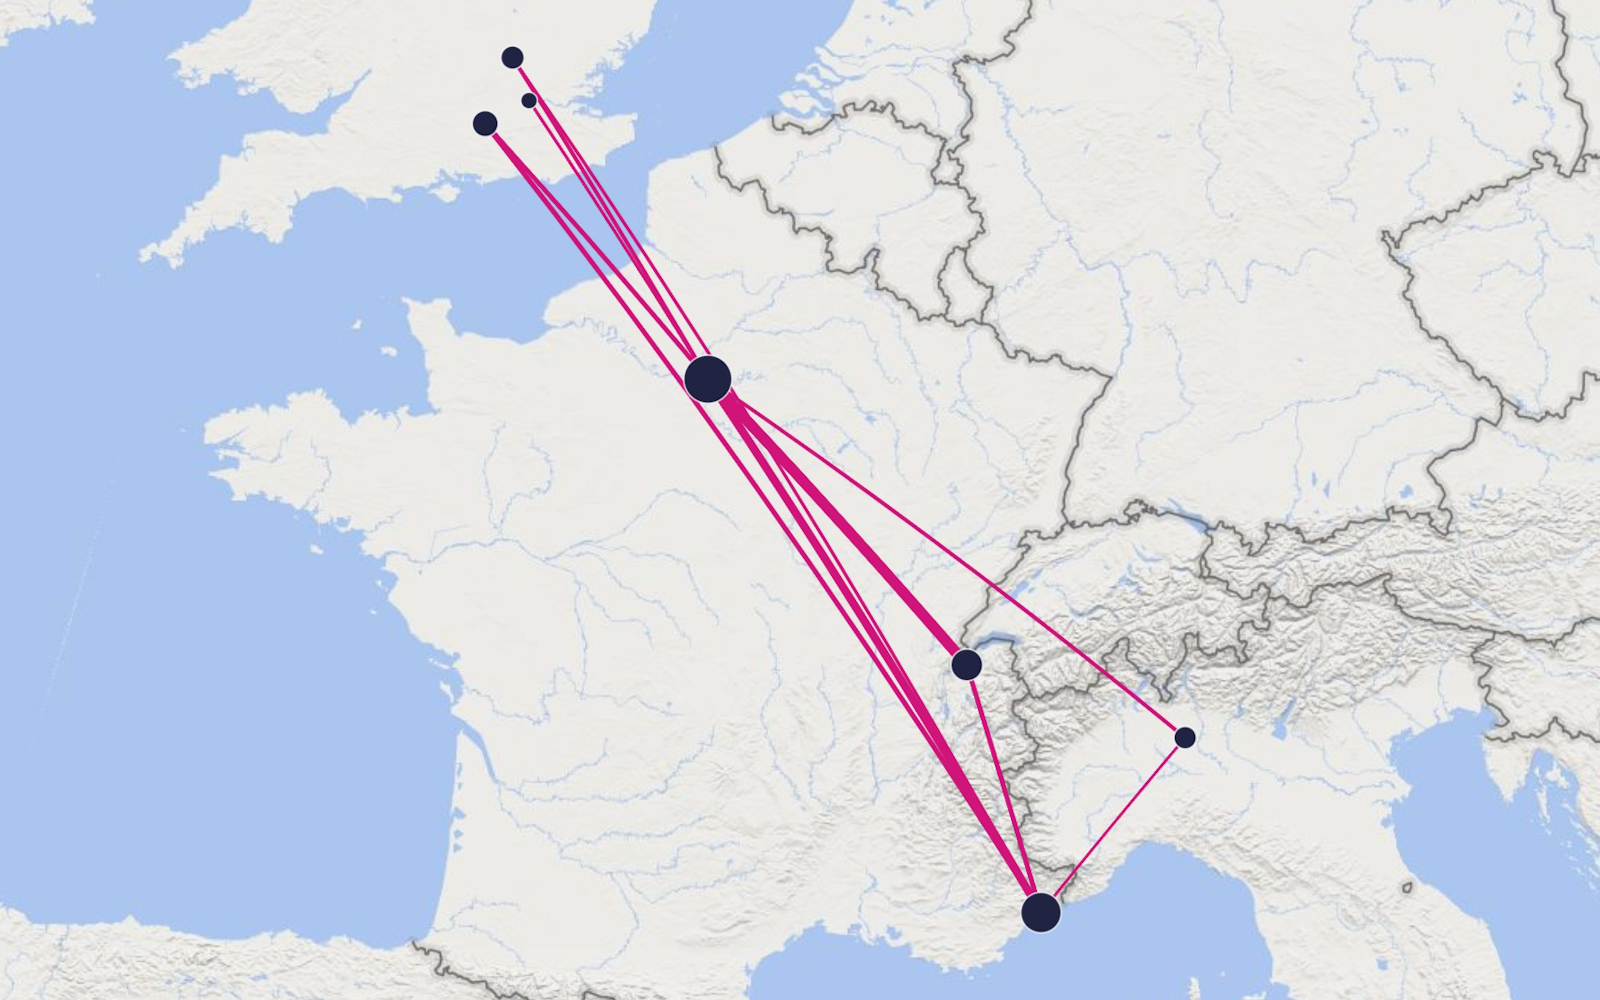
Top 10 airports pairs - Flights 2024 - both ways (growth over 2023)
|
Paris Le Bourget |
Geneva International |
3,363
(-1%) |
|
Paris Le Bourget |
Nice Côte d Azur |
2,641
(+1%) |
|
Nice Côte d Azur |
Geneva International |
1,749
(+4%) |
|
Nice Côte d Azur |
Farnborough |
1,460
(-13%) |
|
Paris Le Bourget |
London Luton |
1,439
(+4%) |
|
Paris Le Bourget |
Farnborough |
1,428
(-11%) |
|
Paris Le Bourget |
Milano Linate |
1,332
(-1%) |
|
Nice Côte d Azur |
London Luton |
1,200 |
|
Paris Le Bourget |
London Biggin Hill |
1,189
(+6%) |
|
Nice Côte d Azur |
Milano Linate |
1,116
(+7%) |
FRANCE
Business aviation fleet figures
Based aircraft
Registered aircraft
-

3
1
Bizliner
-

91
43
Heavy Jet
-

51
42
Midsize Jet
-

120
86
Light Jet
-

104
85
Twin Engine Turboprop
-

126
94
Single Engine Turboprop
| Top active aircraft (2024) | Segment | Departures | Arrivals | Totals |
|---|---|---|---|---|
| Pilatus PC-12 | Turboprop | 13,251 | 13,308 |
26,559
(-2%) |
| Embraer Phenom 300 | Light Jet | 8,171 | 8,161 |
16,332
(+8%) |
| Cessna Citation Mustang | Light Jet | 6,856 | 6,850 |
13,706
(-9%) |
| Socata TBM 700 | Turboprop | 6,318 | 6,318 |
12,636
(-5%) |
| Cessna Citation Excel / XLS | Light Jet | 6,026 | 6,008 |
12,034
(-8%) |